Dashboard
Dashboard serves as the homepage of Safous admin portal. The dashboard displays analytical informations regarding the status of your tenant.
Below is an example of how the Dashboard looks like and its explanation:
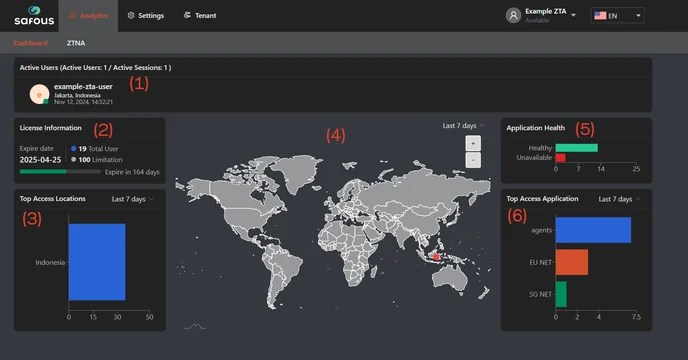
- Active Users: Displays the number of active users along with their session counts, geolocation, and session start timestamps.
- License Information: Provides details on license expiry date, usage limits, and total license consumption, including a countdown to the expiry date.
- Top Access Location: Highlights the most frequently accessed user locations within a specified time frame, with options for the last 7 days or the last month.
- User Location Map: Visual representation of user locations on a map.
- Application Health: Indicates the number of healthy and unhealthy applications.
- Top Access Applications: Lists the most accessed applications by users within a given time frame, with options for the last 7 days or the last month.